|
|
|
|
|
|
Cherbourg-Octeville population statistics
|
|
|
|
Historical data of the population of Cherbourg-Octeville from 1968 to 2007
Historical data of the population of Cherbourg-Octeville from 1968 to 2007 :
Population of Cherbourg-Octeville was 40 288 inhabitants in 2007, 42 288 inhabitants in 1999, 45 241 inhabitants in 1990, 46 993 inhabitants in 1982, 48 513 inhabitants in 1975 and 47 708 inhabitants in 1968.
This population Census of the city of Cherbourg-Octeville was made without duplicated data, which means that each Cherbourg-Octeville resident that have ties to another municipality is counted only once for the two municipalities.
|
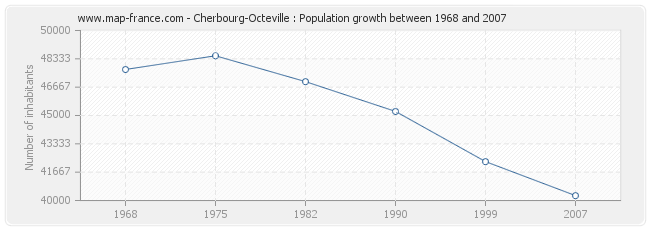
Population Cherbourg-Octeville
|
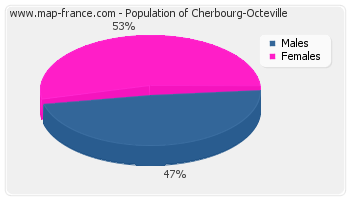
Population distribution of Cherbourg-Octeville by sexe
Population distribution of Cherbourg-Octeville by sexe :
- Men inhabitants Cherbourg-Octeville in 2007 were 19 084
- Women inhabitants in 2007 were 21 204
|
|
Evolution of the population of Cherbourg-Octeville
|
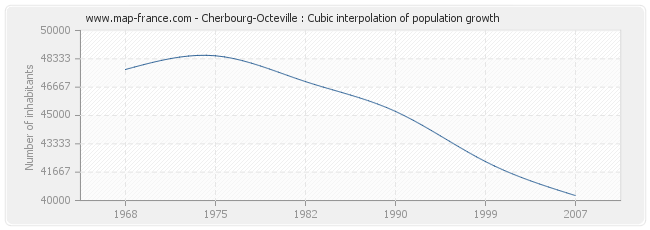
Population of Cherbourg-Octeville from 1968 to 2007 :
This curve shows the history of the population of Cherbourg-Octeville from 1968 to 2007 in cubic interpolation. This provides more precisely the population of the municipality of Cherbourg-Octeville the years where no census has been taken.
- Population of Cherbourg-Octeville in 2007 : 40 288 inhabitants
- Population of Cherbourg-Octeville in 1999 : 42 288 inhabitants
- Population of Cherbourg-Octeville in 1990 : 45 241 inhabitants
- Population of Cherbourg-Octeville in 1982 : 46 993 inhabitants
- Population of Cherbourg-Octeville in 1975 : 48 513 inhabitants
- Population of Cherbourg-Octeville in 1968 : 47 708 inhabitants
|
|
Cherbourg-Octeville : births and deaths
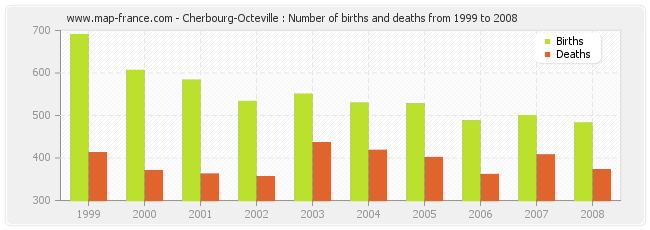
Cherbourg-Octeville : births and deaths from 1999 to 2008
- Cherbourg-Octeville in 2008 : 482 births and 372 deaths
- Cherbourg-Octeville in 2007 : 499 births and 407 deaths
- Cherbourg-Octeville in 2006 : 487 births and 361 deaths
- Cherbourg-Octeville in 2005 : 527 births and 401 deaths
- Cherbourg-Octeville in 2004 : 529 births and 418 deaths
- Cherbourg-Octeville in 2003 : 550 births and 436 deaths
- Cherbourg-Octeville in 2002 : 533 births and 356 deaths
- Cherbourg-Octeville in 2001 : 583 births and 362 deaths
- Cherbourg-Octeville in 2000 : 606 births and 370 deaths
- Cherbourg-Octeville in 1999 : 690 births and 412 deaths
|
|
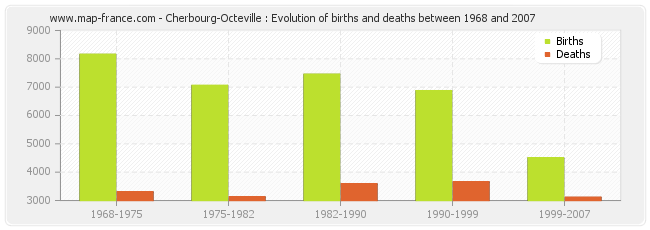
Cherbourg-Octeville : evolution of births and deaths from 1968 to 2007
- From 1999 and 2007 : 4 505 births and 3 116 deaths.
- From 1990 and 1999 : 6 876 births and 3 661 deaths.
- From 1982 and 1990 : 7 459 births and 3 588 deaths.
- From 1975 and 1982 : 7 066 births and 3 132 deaths.
- From 1968 and 1975 : 8 163 births and 3 306 deaths.
|
|
Distribution of the population of Cherbourg-Octeville by age
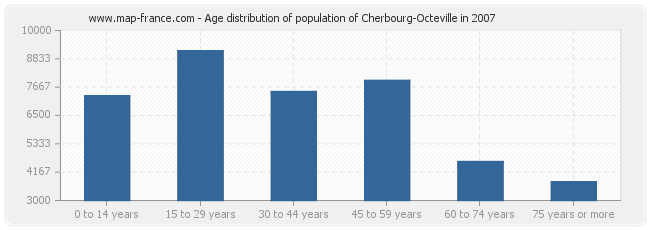
Distribution of the population of Cherbourg-Octeville by age in 2007 :
- Population of Cherbourg-Octeville from 0 to 14 years : 7 315 inhabitants
- Population of Cherbourg-Octeville from 15 to 29 years : 9 166 inhabitants
- Population of Cherbourg-Octeville from 30 to 44 years : 7 488 inhabitants
- Population of Cherbourg-Octeville from 45 to 59 years : 7 948 inhabitants
- Population of Cherbourg-Octeville from 60 to 74 years : 4 606 inhabitants
- Population of Cherbourg-Octeville from 75 years or more : 3 765 inhabitants
|
|
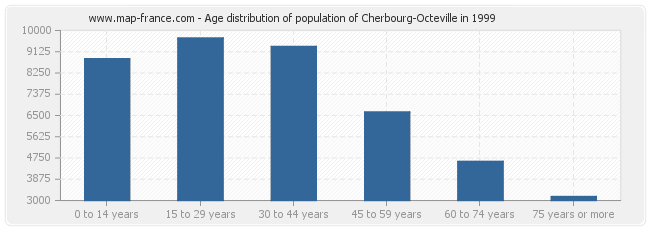
Distribution of the population of Cherbourg-Octeville by age in 1999 :
- Population of Cherbourg-Octeville from 0 to 14 years : 8 835 inhabitants
- Population of Cherbourg-Octeville from 15 to 29 years : 9 690 inhabitants
- Population of Cherbourg-Octeville from 30 to 44 years : 9 344 inhabitants
- Population of Cherbourg-Octeville from 45 to 59 years : 6 642 inhabitants
- Population of Cherbourg-Octeville from 60 to 74 years : 4 613 inhabitants
- Population of Cherbourg-Octeville from 75 years or more : 3 164 inhabitants
|
|
Men population of Cherbourg-Octeville in 2007
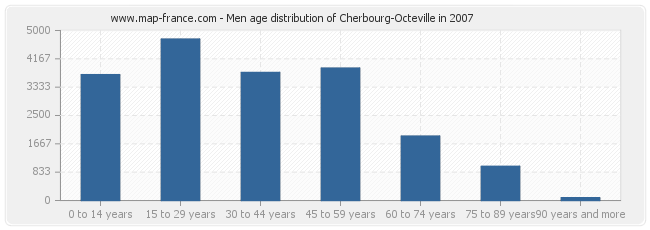
Men population distribution of Cherbourg-Octeville by age in 2007 :
- Cherbourg-Octeville men inhabitants from 0 to 14 years : 3 701
- Cherbourg-Octeville men inhabitants from 15 to 29 years : 4 746
- Cherbourg-Octeville men inhabitants from 30 to 44 years : 3 766
- Cherbourg-Octeville men inhabitants from 45 to 59 years : 3 893
- Cherbourg-Octeville men inhabitants from 60 to 74 years : 1 893
- Cherbourg-Octeville men inhabitants from 75 to 90 years : 1 006
- Cherbourg-Octeville men inhabitants of 90 years and more : 80
|
|
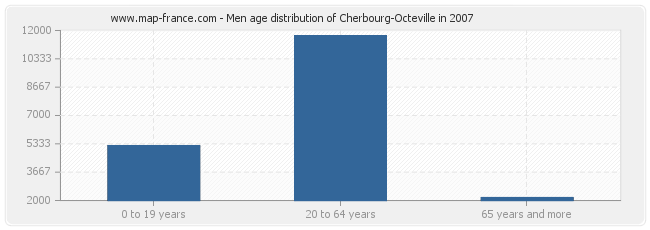
Men population distribution of Cherbourg-Octeville by age in 2007 :
- Cherbourg-Octeville men inhabitants from 0 to 19 years : 5 225
- Cherbourg-Octeville men inhabitants from 20 to 64 years : 11 689
- Cherbourg-Octeville men inhabitants of 65 years and more : 2 170
|
|
Population féminine of Cherbourg-Octeville in 2007
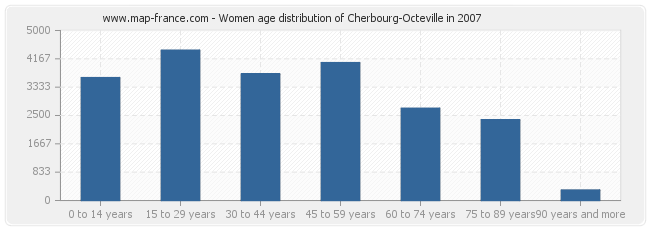
Women population distribution of Cherbourg-Octeville by age in 2007 :
- Cherbourg-Octeville women inhabitants from 0 to 14 years : 3 614
- Cherbourg-Octeville women inhabitants from 15 to 29 years : 4 420
- Cherbourg-Octeville women inhabitants from 30 to 44 years : 3 722
- Cherbourg-Octeville women inhabitants from 45 to 59 years : 4 055
- Cherbourg-Octeville women inhabitants from 60 to 74 years : 2 713
- Cherbourg-Octeville women inhabitants from 75 to 90 years : 2 373
- Cherbourg-Octeville women inhabitants of 90 years and more : 306
|
|
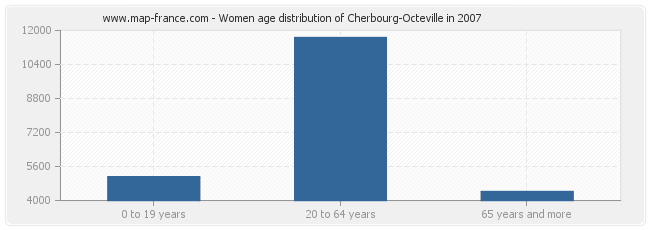
Women population distribution of Cherbourg-Octeville by age in 2007 :
- Cherbourg-Octeville women inhabitants from 0 to 19 years : 5 112
- Cherbourg-Octeville women inhabitants from 20 to 64 years : 11 669
- Cherbourg-Octeville women inhabitants of 65 years and more : 4 423
|
|
|
Other population statistics, maps, hotels of towns in france
Find the population data of another town, zip code, department, region, ...
Quick links Cherbourg-Octeville :
Back to the menus Map of France :
Make a link to this page of Cherbourg-Octeville with the following code :
|
|
Map of France | Regions | Departments | Cities | Partners | Terms | Contact
|
